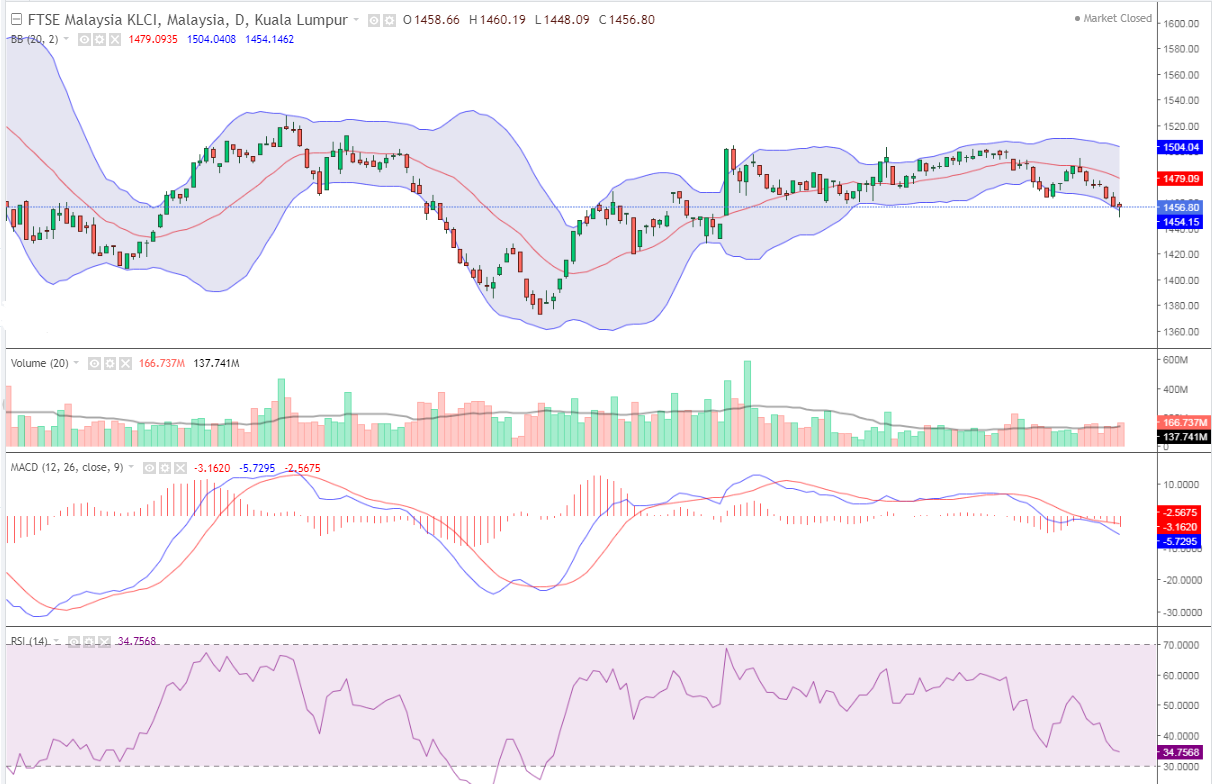
 KLSE is forming ROUNDING TOP pattern on daily chart. It may break resistance level 1465 in this week. It may go upto 1475 in this week. On the daily chart KLSE is in down trend. Primary trend is up trend and secondary trend is down trend. RELATIVE STRENGTH INDEX is 33. There is resistance level at 1465. This level 1465 may break in this week. If it is break this level then it can go more upside. Bursa Malaysia ended the trading week almost flat on weak sentiment, in line with most regional peers, despite the upbeat Wall Street performance overnight, said an analyst. At 5pm on Friday (Feb 24), the benchmark FTSE Bursa Malaysia KLCI (FBM KLCI) eased 0.85 of-a-point or 0.06% to end at 1,456.80, from Thursday’s close of 1,457.65. The index opened 1.01 points firmer at 1,458.66, and moved between 1,448.09 and 1,460.19 throughout the trading day. On the broader market, decliners led advancers 537 to 419, while 386 counters were unchanged, 893 untraded and 28 others suspended.
Copyright © 2024 | WordPress Theme by MH Themes
Leave a Reply