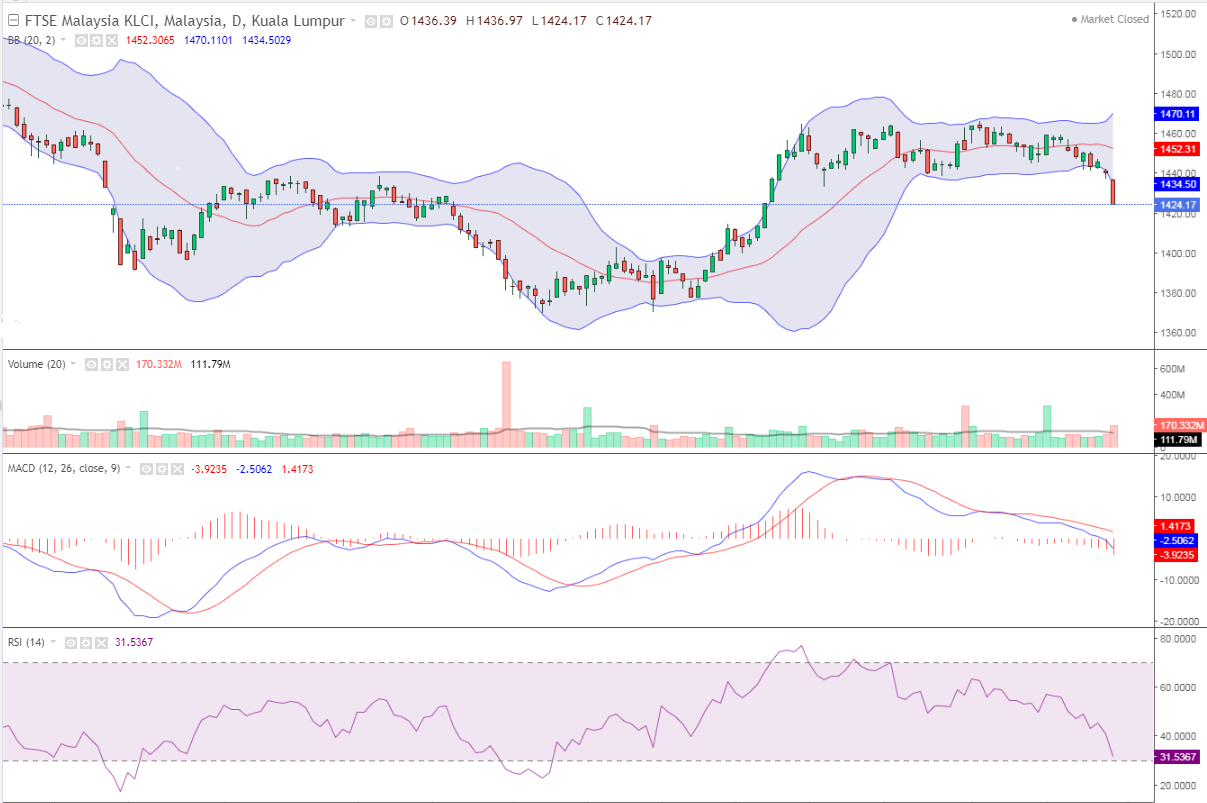
KLSE is forming ROUNDING TOP PATTERN on daily chart. It has broken support level 1438 with heavy volume. It may bounce back from support level 1410 in this week. It may go upto 1410 in this week. On the daily chart KLSE is in down trend. Primary trend is down trend and secondary trend is also down trend. RELATIVE STRENGTH INDEX is 31. There is support level at 1410. It may bounce back from support level 1410 in this week. If it is bounce back from this level then it can go upside. Bursa Malaysia bucked the regional trend to end the week sharply lower due to broad-based selling. With the key index falling 1.10%, investors exercised caution due to global inflation concerns, fuelled by elevated crude oil prices and the looming US government shutdown. At 5pm, the FTSE Bursa Malaysia KLCI (FBM KLCI) eased 15.94 points to 1,424.17 to mark its intraday low from Wednesday’s close of 1,440.11. The benchmark index, which opened 3.72 points easier at 1,436.39, hit an intraday high of 1,436.97 in the morning session before succumbing to selling pressure in late trading. On the broader market, decliners beat gainers 578 to 379 while 438 counters were unchanged, 990 untraded and 98 others suspended. Turnover increased to 3.03 billion units worth RM2.43 billion from 2.97 billion units worth RM1.94 billion on Wednesday.
Leave a Reply