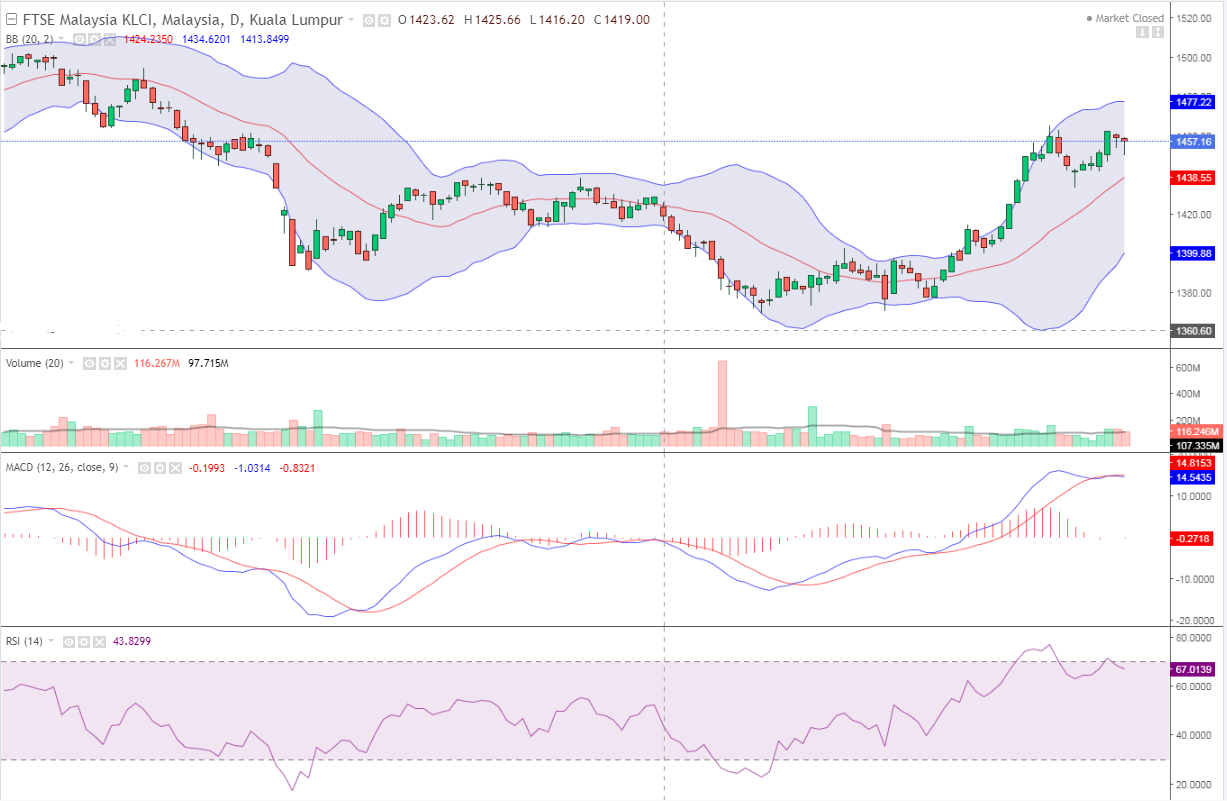
 KLSE has formed ROUNDING BOTTOM PATTERN on daily chart. It has broken resistance level 1439 with heavy volume. It may break next resistance level 1480 in this week. It may go upto 1485 in this week. On the daily chart KLSE is in up trend. Primary trend is down trend and secondary trend is up trend. RELATIVE STRENGTH INDEX is 74. There is resistance level at 1480. This level 1480 may break in this week. If it is break this level then it can go more upside. Bursa Malaysia’s stock indexes managed to pare back some of its losses over the afternoon session but ultimately finished the week on a low note, most likely influenced by the impending state elections that are scheduled to be held tomorrow. At 5 pm, the FTSE Bursa Malaysia KLCI (FBM KLCI) eased 1.71 points to 1,457.16 from 1,458.93 at Thursday’s close. There were 502 gainers, 382 losers and 429 counters traded unchanged on the Bursa Malaysia while turnover was at 2.940 billion shares valued at RM1.863 billion.
Copyright © 2024 | WordPress Theme by MH Themes
Leave a Reply