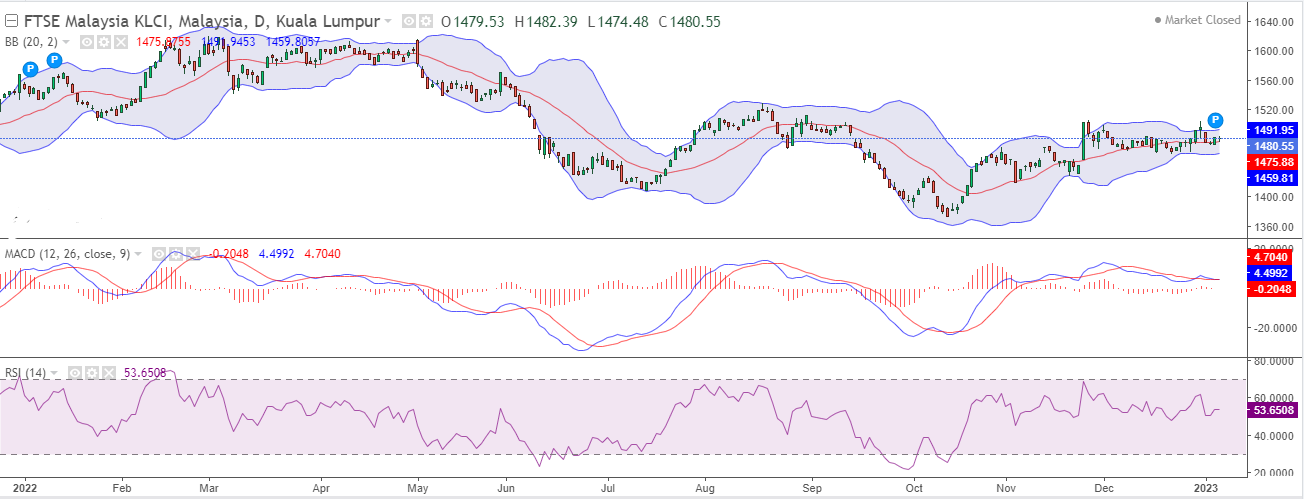
 KLSE is forming CUP AND HANDLE pattern on daily chart. It may break resistance level 1505 in this week. It may go upto 1520 in this week. On the daily chart KLSE is in up trend. Primary trend is up trend and secondary trend is up trend. RELATIVE STRENGTH INDEX is 52. There is strong resistance level at 1505. This level 1505 may break in this week. If it is break this level then it can go more upside. Bursa Malaysia pared most of its earlier losses to end marginally lower on the first trading week of this year on lack of positive catalysts, amid a mixed performance on regional bourses. At 5pm, the benchmark FTSE Bursa Malaysia KLCI (FBM KLCI) eased 0.38 of-a-point to 1,480.55 from Thursday’s closing of 1,480.93. The market bellwether opened 1.4 points lower at 1,479.53 and moved between 1,474.48 and 1,482.39 throughout the day. Market breadth was negative with decliners outpacing advancers 452 to 383, while 408 counters were unchanged, 967 untraded, and nine others suspended.
Copyright © 2024 | WordPress Theme by MH Themes
Leave a Reply